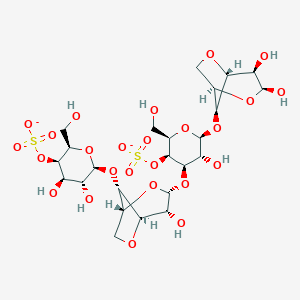
Thermo-responsive polymers that can react to temperature variation and undergo reversible changes in material state or phase transitions (sol-gel or gel-sol transformations) have recently attracted attention in bio-related and food industry applications such as drug delivery systems, bio-inks, food stabilizing and thickening agents. κ-Carrageenan is an important class of polysaccharides, and a non-toxic and biocompatible hydrogel that shows an interesting thermo-reversible sol-gel transition upon cooling the solution.
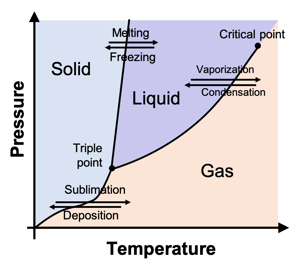
Gelation temperature is the temperature at which polymer solidified and forms gel. The gelation temperature or sol-gel transition of κ-Carrageenan can be tuned with the addition of counterions or changing concentration. Increasing the concentration of κ-carrageenan can significantly promote gelation and shift the sol-gel transition from very low temperatures (e.g., 4˚C) to room temperature and above. Knowing the concentration dependency of the sol to gel transition (gelation temperature), we can determine the phase diagram by plotting the gelation temperature as a function of concentration. The phase diagram can be used to predict the phase changes that occurs in the polymer and to determine which combinations of temperature and concentration make just gel or just fluid. Evaluating thermal phase diagram of polymers is important in controlling their structure -property relationship. For example, this valuable information can be used to select the most appropriate thermo-responsive polymer formulation for different bio-related (e.g. drug delivery) and food industry applications.
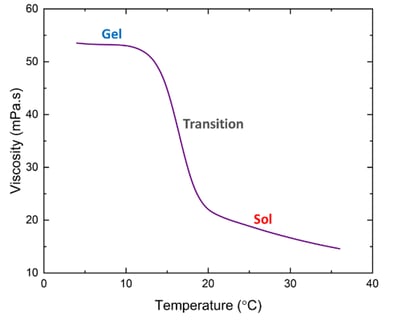
There are useful tools for the determination of sol-gel transition of polymers including differential scanning calorimetry (DSC) and dynamic light scattering (DLS). An alternative technique that is effective for understanding the sol-gel transition at varying concentrations is based on viscosity measurements upon a cooling temperature sweep experiment. The sharp increase in viscosity is an indication of gel formation.
In our application note, Determining Thermal Phase Diagram of κ-Carrageenan by Monitoring Viscosity, we show how we use VROC® initium one plus to probe temperature-dependent viscosity and identify gelation temperature of κ-carrageenan during a cooling temperature sweep experiment. The VROC® initium one plus allows us to measure small sample volume and monitor small changes in viscosity with high accuracy and repeatability.

Written by: Sohelia Shabaniverki, PhD, RheoSense Applications Scientist