Concentrated protein solutions are widely used in biopharmaceutical research and development, especially in the formulation of injectable drug candidates. The goal of these concentrated solutions is to pack as much protein as possible into your solution to help improve efficacy and reduce the amount of solution required for dosage to a patient. Viscosity control for concentrated protein solutions is very important for the manufacturability and drug delivery routes of many protein therapeutics of the pharmaceutical industry (Zhang et al., 2017).

The long-term stability of pharmaceutical formulations containing proteins or antibodies is a continual concern. In general, these systems are kinetically, rather than thermodynamically stable. Meaning, the changes in these solutions can occur over extended periods of time and are dependent on the component interactions and mobility. Also, the conformation of the individual molecules can adjust with time which can in turn alter the protein-protein interactions (PPI) by hiding or exposing functional groups. Regardless of the exact scenario, protein formulations are dynamic. Viscosity serves as an ideal indicator of stability since it is highly sensitive to changes in the individual proteins, PPI, and the resulting microstructure.
Single point viscosity measurements of complex fluids can suffice for quality control or screening purposes if the shear rate is chosen carefully or the formulation is confirmed Newtonian. However, it is generally advantageous to explore the shear rate dependence. Since rheological properties reflect both the PPI and the resulting microstructure or spatial arrangement of molecules, correlations between buffer composition and the molecular level behavior of the proteins can be made.
A thorough viscosity analysis of protein formulations should include both shear rate and temperature variation. The data can be used for practical purposes such as performance prediction at any relevant temperature. It can also be utilized to investigate the component interactions and resulting microstructure. Simple analysis tools such as model fitting and scaling can be employed to facilitate both objectives.
Ionic strength is a key formulation parameter to control the viscosity of protein solutions. However, the impact of varying ionic strength is not independent of the other buffer characteristics such as pH, which determines the net or mean charge of the protein molecules. Proteins will have a zero-net charge at the isoelectric point (pI) and an increasingly positive or negative charge as the pH deviates from this value. This charge magnitude will determine the dominant protein-protein or pair interactions and influence the sensitivity to other formulation component variations. Dilute solution viscosity data is highly sensitive to changes in the PPI that can occur with these formulation variations and can help to reveal the main types of interactions controlling formulation behavior. Ionic strength and pH are key parameters determining the macroscopic behavior of protein solutions.
Introducing salts at low levels can increase a protein’s solubility and is commonly referred to as “salting in”. Since the ions can occupy attractive sites on the protein molecule, the extent of cluster formation is reduced. However, increasing the salt content further can enhance aggregation by dehydrating the protein. This “salting out” effect is most pronounced with anions that are strongly hydrated. The additional counter ions can also screen the electrostatic repulsion when the pH is not at the isoelectric point and the proteins have a net charge. These changes in the protein-protein interaction (PPI) and resulting structural arrangement will influence the solution viscosity as well as the solubility. Viscosity reflects protein pair interactions and the extent of aggregation. An increase in attraction and reversible cluster formation leads to an elevation in viscosity. Therefore, in addition to the practical application of viscosity data, information regarding PPI and microstructure can be extracted as well.
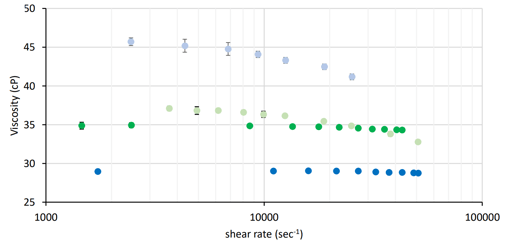
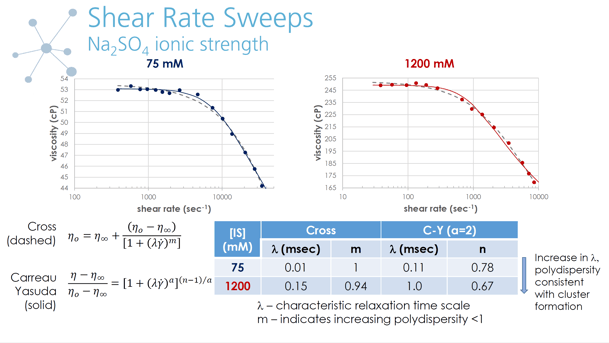
Changes in protein pair interactions induced by varying buffer composition significantly impact the shear rate dependent viscosity of concentrated protein solutions. Varying shear rate provides information on characteristic times scales of the formulation. Shear rate sweeps offer the opportunity to extract more detailed information about formulation components and microstructure, specifically to determine the onset of non-Newtonian behavior and assess the correlation of increased cluster size with increased plateau viscosity. A scaling analysis commonly used for traditional colloidal systems can be applied to dependent viscosity data collected for concentrated model protein solutions to generate a master curve.
The scaling process also yielded a characteristic length scale thought to be associated with the size of protein clusters or aggregates (Godfrin et al., 2016). The observed relationship between low shear plateau viscosity and the estimated cluster size is consistent with protein aggregate formation as the root cause of high viscosity protein formulations. Although the length scale is a relative ranking in the absence of complementary sizing measurements such as scattering techniques, it is a valuable tool to assess the impact of buffer variations on PPI and the resulting extent of aggregation.
.png?width=600&name=Webinar_%20non-Newtonian%20Scaling%20Analysis%20for%20Protein%20Solutions%20Download%20Webinar!%20(1).png)
Applying a scaling analysis to data gathered from shear rate sweeps at multiple temperatures can be used to determine if temperature variation produces changes in protein cluster formation. As temperature is increased, diffusion or thermal motion becomes more rapid. For simple fluids, such as solvents or buffers, this results in a decrease in dynamic viscosity. This trend generally holds true for many complex fluids as well. Exceptions do exist, such as samples with temperature induced phase separation or self-assembly such as Poloxamers. Temperature variation can also affect aggregation behavior of colloidal systems due to changes in the pair interaction potential. Since the colloidal model is often used as a framework to interpret protein solution behavior, it is of interest to investigate the impact of temperature on the cluster formation of inherently attractive proteins.

Concentrated protein solutions experience a broad range of temperatures from cold storage to body temperature or even higher during an accelerated aging study. Therefore, it is very practical to measure the viscosity of protein formulations at these temperatures to predict the ability to handle or process under all relevant conditions. There is also evidence that the rate of increase in viscosity with inverse temperature, as characterized by the activation energy, reflects the dynamics of protein clusters or aggregates.
The viscosity of protein solutions can rise rapidly with both increasing concentration and decreasing temperature. Since variability can exist in both the formulation process and environmental conditions, measuring viscosity at multiple concentrations and temperatures provides practical benefit. A recent example of this type of study can be found in Schwenger et al. (2019) where viscosity was measured over a range of these parameters relevant to the manufacturing process. Existing models were applied to predict changes in viscosity with the intent of improving outcomes such as fill volume accuracy. Alternatively, similar studies have been performed in combination with complimentary scattering experiments to probe the solution microstructure and protein cluster dynamics (Dharmaraj et al., 2016).
There are many options for viscosity testing. When determining what viscosity testing is best for your solutions, it is important to identify your research and development goals and what parameters and measurements are most important and relevant to those goals. True viscosity is one of the most important parameters in the development and modeling of applications that involve fluid flow. Viscosity can be calculated using various methods and there are numerous viscometers on the market today, but not all viscometers are made alike. Many viscometers on the market today are only capable of accurately measuring viscosity of Newtonian fluids, and often only approximate the apparent properties of fluids, failing to quantify the true viscosity. VROC® instrumentation is very flexible, measuring dynamic viscosity over a wide dynamic range of operation, and delivering data with the highest accuracy and repeatability.

Written by: Dr. Stacey Elliott, Rheosense Principal Scientist