
I recently got a pretty challenging question from one of my customers who mentioned that their professor had given a lecture back in undergrad about r-squared values not being a trustworthy method to determine how close your data is to the regression line. Now I don't want to undermine the professor's argument as I understand where such opinions come from.
After learning a little bit about the specifics and learning the mathematics, I wanted to share the details. In general, if your data is good overall, your r-squared values will not change a lot. However, when your data is bad, your r-squared values could be all over the place. Therefore, it's understandable why some people would question the validity of the r-squared values.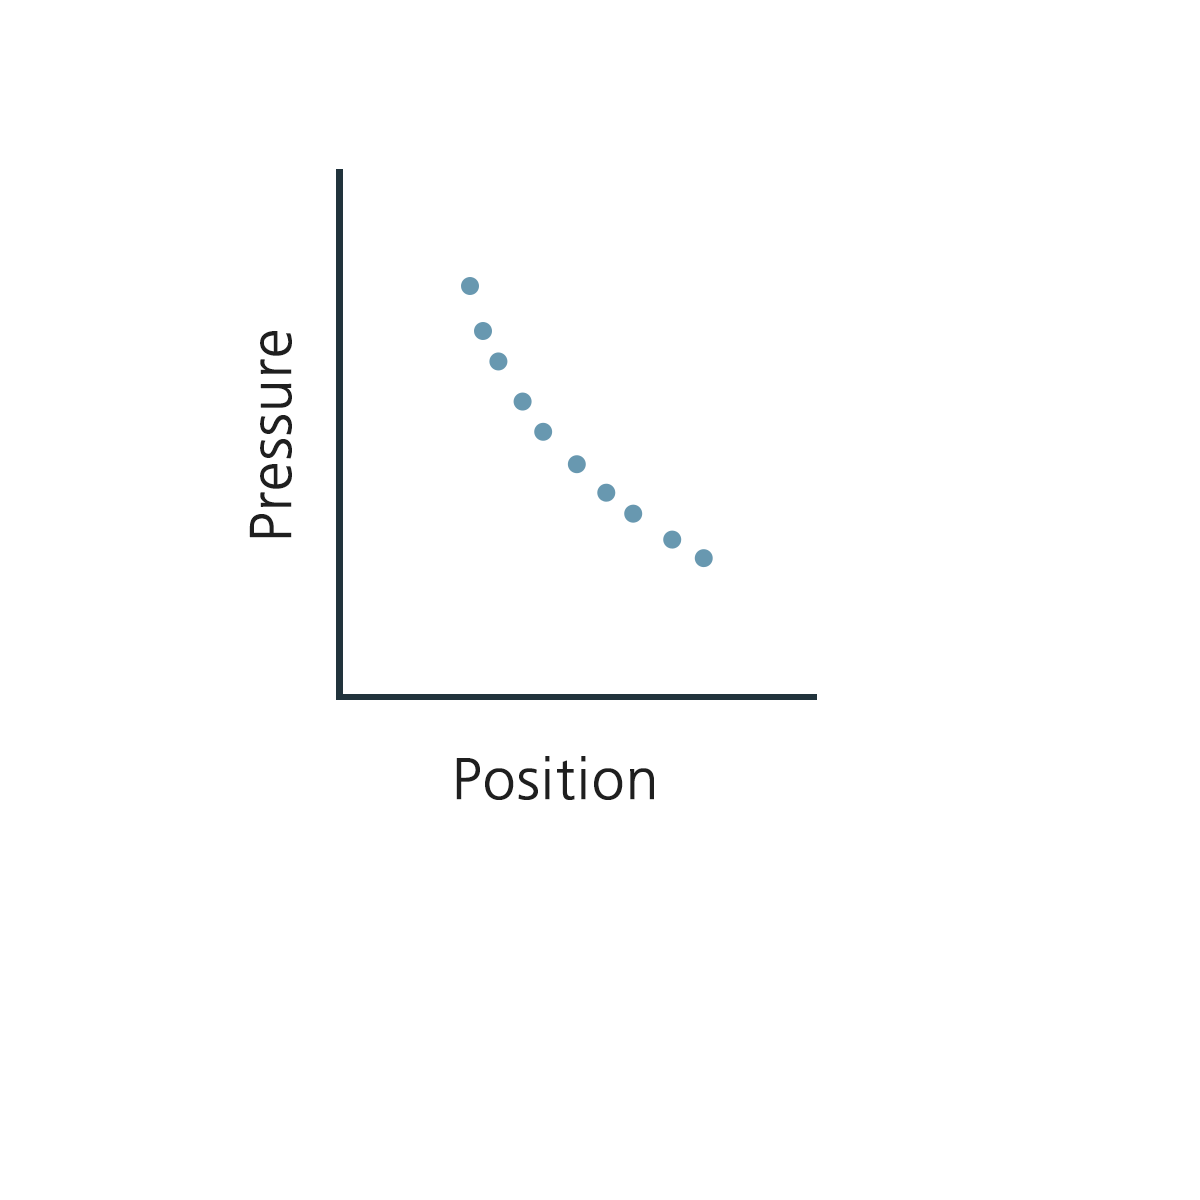
.png?width=600&name=Pressure%20vs.%20Position%20(Situation2).png)
There are many ways to plot data such as this but you need to find the best fit. For data above the regression line and below, because it is (+) and (-), you will need to square.
Then
1) Calculate the difference
2) Error = ∑ (Pi-P(position))2
3) Determine the error and minimize error by checking the square linear curve fitting
So with this, comes the question of how good is your error? What is your reference point when you do not have one?
You will need to have more to compare to (aka a reference point).
In general, people take the average of (4) readings. When you're comparing to a terrible curve fitting, of course your rsquared values will be terrible. So you need to work with software that averages and then calculate the error. As a result, all RheoSense viscometers come with optional or required software that calculates at least 3 decimal points for microVISC and at least 4 decimal points for m-VROC and VROC initium. Other lab equipment out in the field, from my experience, has bigger noise so it is sometimes hard to have up to 4 decimal points on the data.
Because our viscometers are "Simply Precise," precision is high so we can distinguish the difference between 0.999 to 0.9998 for m-VROC and at least 3 decimal points for microVISC such as 0.9110 to 0.9120.
Higher precision to get higher resolution is the key. All RheoSense sensors have high precision and low noise so we are able to achieve this.
For more information or inquiries, contact us here.