
When designing a strategy for complete material characterization using viscosity measurements, there are 4 steps to follow to successfully create and execute your strategy. These steps are repeatable and applicable across a wide range of applications, from proteins characterization to polymers, inks, oils, and more!
Step One
To successfully create a strategy for material characterization using viscosity measurements, it is important to begin by clearly defining your goals. Understanding your goals will allow you to determine how viscosity data can be used to achieve these goals, which will guide you as you determine the right instrument is best for your application.
These goals can range from quality control, or quick screen, to predicting specific performance properties or even sample characterization and exploration. Measurement goals focused around trying to predict specific performance properties are most common in formulation or development - when you need to know how a sample will perform in a real-life application based on a parameter.
Step Two
Once you have a clear understanding of your experimental goals, it's time to design and experiment that will help you to achieve those goals. When you are designing your experiment it is important to identify what testing and formulation parameters are relevant to your experiment. Testing parameters can range from a quick screen to a thorough sample characterization.
Quick screen testing parameters are typically adequate to establish a single point type measurement, however when choosing shear rate and temperature it's important to maximize the differentiation that you are trying to identify.
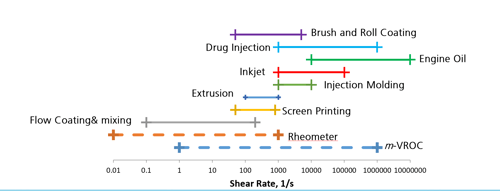
If your goals are focused on performance prediction you need to estimate the most practical or realistic shear rates that can be extracted from your measurements. It is also important to consider all storage and application temperatures relevant to your sample and the common conditions you are trying to simulate in your testing. This include processing conditions and temperatures as well. When goals include thorough sample characterization, you must consider a broad range of parameters, including shear rates and temperatures. Once you have identified your testing parameters you can create testing plans designed around these specific parameters.
Step Three
The next step in creating a successful experimental strategy is choosing the right tools, understanding sample volume requirements, and creating your measurement protocols. When determining the right instrument for your testing it's important to consider:
- Viscosity range
- Fluid behavior - Newtonian or non-Newtonian
- Yield stress
- Sample stability
- Sample volume (volume of sample you have available for testing)
- Microfluidics
- Particulates/ aggregates
- Solubility
- Length scale of phase separation or inhomogeneity
When choosing what instrument is best for your experimental strategy it is also important to consider throughput, automation, portability, and sample retrieval and recovery options. Once you have selected the right instrument for your experimental testing, you can create your measurement protocols.
Step Four
Sample measurement is only a piece of your experimental strategy. Correctly processing, analyzing, and interpreting the viscosity data is crucial for research, development and formulation. Data analysis often involves determining injectability, hydrodynamic size determination, quantifying protein-protein interactions, and storage stability to name a few applications.
Processing your data begins with data organization, consolidation and analysis, followed by transformation of your analysis into a digestible presentation. This translation of your data to a digestible presentation typically involves applying non-Newtonian data corrections and model fitting to facilitate sample characterization.
Download our Master Class Playback to learn more about the steps required to create and execute a strategy for complete mAb/protein characterization using viscosity measurements!
-1.jpg?width=600&name=mAb%20Master%20Class%20Email%20Signature(1)-1.jpg)
VROC® technology designed to make sample measurement simple, and to simplify data analysis. Each of our VROC powered viscometers is supported by its own software. The software helps to automate measurements, simplify protocols creation, and to organize and analyze your data.
RheoSense Clariti™ is our proprietary software for data organization and analysis, which integrates with both our m-VROC and VROC initium one plus viscometers. Clariti compresses files such as Excel or Word documents into an easy to view format, generating an array of comprehensive graphs and providing thorough detailed analysis. This software is the first on the market to fully analyze sample injectability as well as calculating and suggesting recommended injection rates based upon your sample data. With Clariti you are able to analyze different syringe types and sizes to find what will be the optimal syringe and drug delivery method with your viscosity measurements. With Clariti you are also able to determine intrinsic viscosity calculations.

 Written by: Eden Reid, RheoSense Senior Marketing and Sales Operations